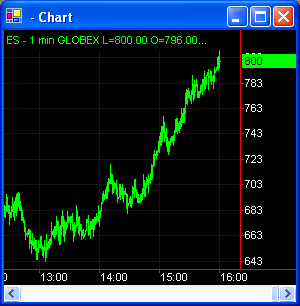
There is a detailed description of creation a Chart.
At first:
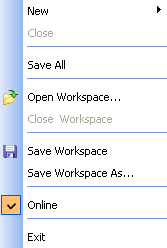
- Use the File menu.
-
Select New.
-
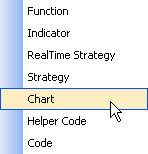
Select Chart.
Now you can see Chart Window. It's empty.
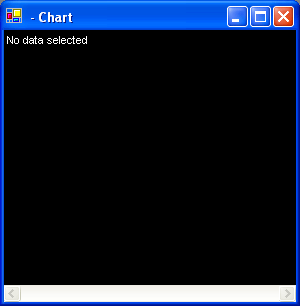
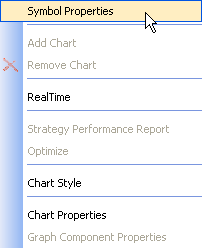
Click the right mouse button anywhere in the Chart Window and choose Symbol Properties.
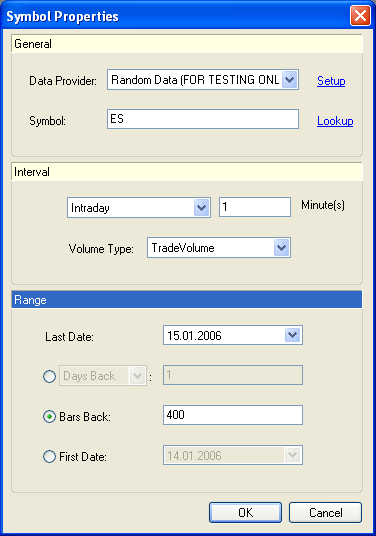
Now you can see Symbol Properties Window
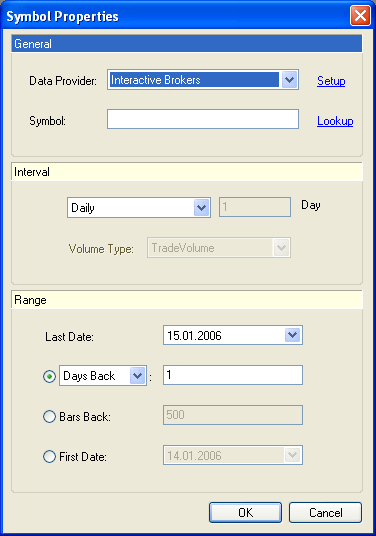
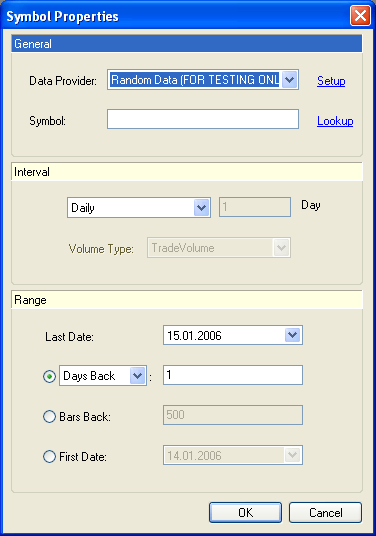
At first you need to choose Data Provider in General tab. For example: Random Data. Then you need to choose Symbol. Click Lookup.
You can see Symbol Lookup Window.
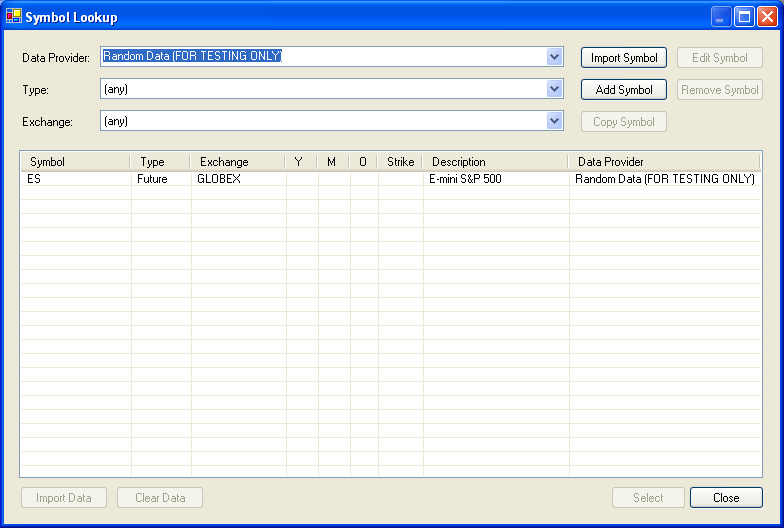
Choose a Symbol from the list and click Select.
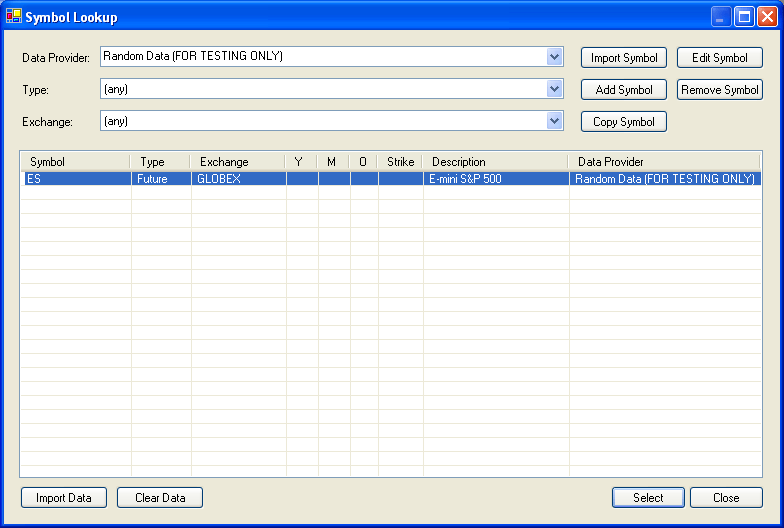
Now you can see Symbol Properties Window again with selected Data Provider and Symbol.
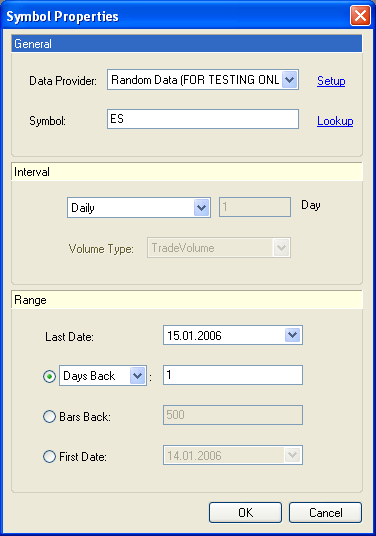
For example now change Interval from Daily to Intraday.
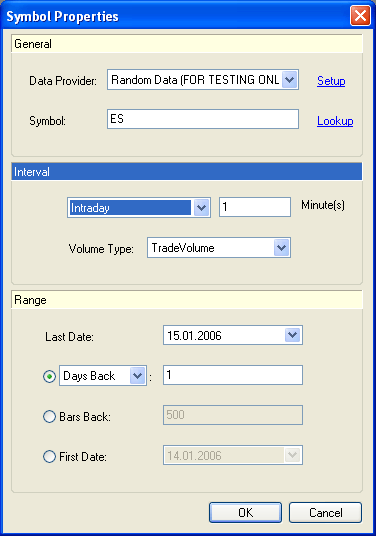
And change Range from Days Back to Bars Back.
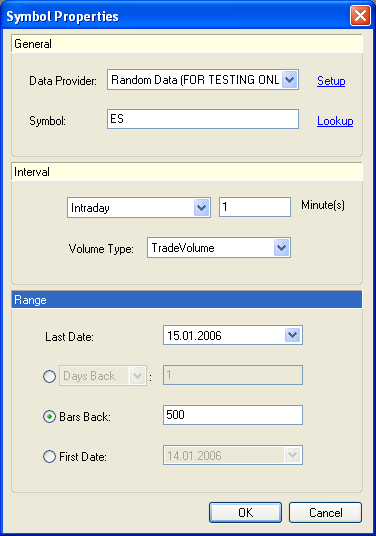
Now for example replace 500 Bars Back to 400. And after all click Ok.
Now you can see the Chart.
