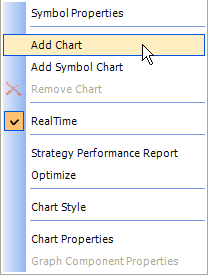
To add a chart at the bottom of existing one
- Make a Chart Window window the active window.
-
Click the right mouse button anywhere in the chart window background on the chart for which you want to add additional chart. Chart context menu will appear.

- Select the Add Chart from the context menu to add additional chart. Select the Add Symbol Chart to add additional symbol chart.
- Resize newly created chart and begin using it.
After that Additional Chart at the bottom ofe existing chart will appear. See Formatting Chart Window to adjust it.