Bar Graphs Tab lets to draw strategy performance charts that contain data bars, trades and any number of Indicators.
You can work with the chart just like with any other chart int the application. See Working With Charts.

Chart Presets are used to save charts and their style.
To load Chart preset
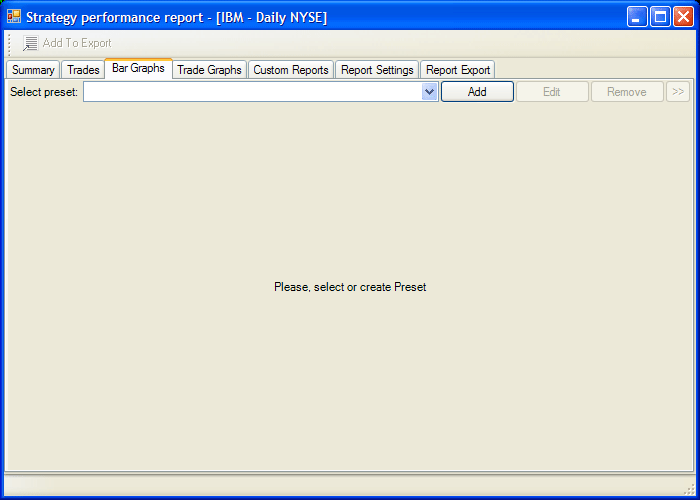
- Initial Bar Graphs Tab view when no chart is loaded:

- Select preset from Select preset list.
To create Chart
- Click Add button.
- Enter new Chart Preset name in the Create Preset
dialog:

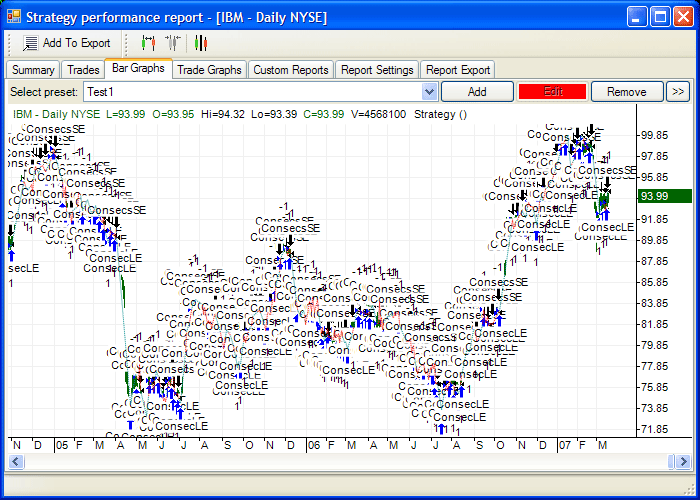
- New chart will be created:

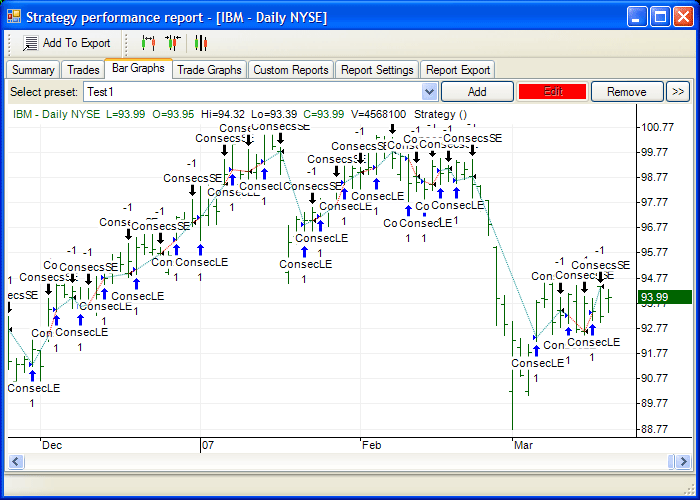
- Use Bar Chart Scaling buttons in the Strategy performance report window toolbar to adjust chart scale. See Bar Chart Scale.
- Chart now should look like that:

- Apply Indicators to the newly created chart and apply Formatting to it.
- You can add additional charts to the bottom of that chart. See Adding Additional Charts.
To edit Chart Preset
- Load Chart Preset you want to edit (if it is not loaded already).
- Click Edit button.
- Edit button becomes red - you can can apply Indicators and Formatting to the chart.
To remove Chart Preset
- Click Remove button.
- Click Yes in the confirmation dialog.
You can also Rename and Copy presets by using
additional actions submenu available by pressing
 button.
See also Exporting Report.